Using historical maps in OziExplorer can be a challenge because of the many standards used in the world of cartography software. Searching the internet, testing and help from experts (Louisiana State University, University of Twente, Kadaster Netherlands and
the OziExplorer user forum) was needed, in this blog I publish my findings to
1: Convert projection parameters and
2: Calculate missing datum shift parameters.
In the Map Collection section of the
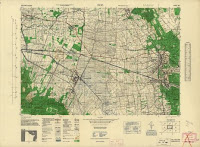
Library of Congress I found a nice serie of Dutch 1:25000 topographic maps, called M831. These maps are made by the US Army Map Service during World War II. You can download them in Jpeg2000 format, because this is not a widely supported format you have to convert them to a more common format. With the freeware program Irfanview you can open these files and save in another format.
Digital MapsA digital map is an image which has been georeferenced (calibrated) so OziExplorer can use any pixel position on the map to determine the true geographic position. To do this calibration you need data about the projection and the datum of the map. The projection and the datum for this mapserie are both not supported by OziExplorer. When searching the internet I discovered that I had to understand where I was searching for.
 Map Projection
A map projection is a means of projecting the spherical earth onto a flat plane. On the border of the maps we find information of the projection used:
Projection: Lambert Conical Orthomorphic
Origin: 49° 30'N and 7° 44'13.95"E
Scale factor: 0.999509081
OziExplorer does not support this projection but
mathematically it is synonymous with the Lambert Conformal Conic, which is supported. Orthomorphic is a classical British term. The "British definition" defines this projection at the Origin with one standard parallel (1SP) and a scale factor where the "American definition" defines this projection with two standard parallels (2SP). From the one standard parallel, the scale factor and the ellipsoidal flattening (explained later at map datum) it is possible to derive the equivalent two standard parallels and then treat the projection as a two standard parallel
Lambert Conformal Conic.
On the internet I could not find conversion software, geo experts told that they don't know of such software. It is possible to determine an estimate by trial and error with software like
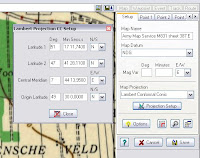
PCTrans, I preferred to write a Javascript (see 1SPto2SP at the bottom of the page) to calculate the values. The formulas I have used are from table 2 of the document
"A new Slovak mapping projection compatible with GPS".The 2 standard parallels for our mapserie are then:
First standard parallel : 47° 41' 28.11"N
Second standard parallel: 51° 17' 11.74"N
CalibrationIn OziExplorer we can now select Load and Calibrate Map Image in the File menu. We setup the projection with the calculated projection parameters and georeference (calibrate) the map by using the grid points of the lat/lon grid on the map as calibration points. The setup of the Map Datum comes later. In the same setup tab we use "Show/hide Corner Markers" to place the Corner Markers on the border around the actual map (called the neat line). This is necessary so OziExplorer can detect where the actual map boundaries are to change maps when you cross this boundary when using moving map real time tracking mode or for drawing grids till the border or when you use MapMerge for OziExplorer utility. After saving the calibration in the .map file you can check the quality by displaying the lat/lon grid with Grid Line Setup.
Map DatumIn the previous step we have georeferenced the map with the local lat/lon grid on the map. The lat/lon coordinates of places on the map depend on what mathematical definition is used to represent the earth when the map was drawn. This reference is called the Datum. The shape of the earth is best defined as a ellipsoid, the defining parameters of the ellipsoid are the semi-major axis (equatorial radius) length (a) and the semi-minor axis ( polar radius) length (b). Mostly it is defined with a and 1/f, where f=(a-b)/a, f is the ellipsoidal flattening.
At least eight constants are needed to form a complete datum: * 3 to specify the location of the origin,
* 3 to specify the orientation of the lat/lon coordinate system and
* 2 to specify the dimensions of the ellipsoid.
In the early days of geodesy, the datum could only be determined for a relatively small area from a local origin on the surface of the earth. This has lead to a proliferation of different ellipsoids with a different size and shape and with other origins and orientations.
This is why every country has his own local Map Datum. For example, the maps in the Netherlands are based on the Bessel ellipsoid of 1841 with Amersfoort as origin.
On the border of our maps we find information about the map datum:
Ellipsoid: Du Plessis 1817, where a=6376523 and 1/f=308.6409971
Origin: 49° 30`N and 7° 44`13.95"E
The GPS system has a global datum:
Ellipsoid: WGS84, with a=6378137 and 1/f=298.257223563
Origin: Earth center
The WGS84 ellipsoid is designed to best-fit the earth as a whole, the local mapping ellipsoid gives a better fit for the area it was designed for.
The fact that different map datums have been used over time means that the latitude and longitude coordinate of a position on the earth's surface is NOT unique, it depends on the datum! With Google Earth, which is based on the WGS84 datum, you can see that the prime meridian of zero longitude is
shifted over more then 100 m of the Observatory in Greenwich. This means that to draw the GPS position of the user on the map the local Map datum is not enough, besides we need the datum shift (displacement and orientation) relative to the global WGS84 datum. There is even more, because of tectonic movements this datum shift must be determined periodically.
Datum ShiftOziExplorer supports many datum shifts but not the one for our map serie. However it is possible to define a user datum shift. This can be done by defining the parameters in the datums.dat file in the OziExplorer directory.
The European Petroleum Survey Group (EPSG) publish many datum shift parameters. There are
multiple transformation methods with different parameters to shift the map datum to the WGS84 datum.
Molodensky-Badekas with 10 parameters:
- 3 to define the displacement (tx, ty, tz),
- 3 to define the rotation (rx, ry, rz),
- 3 to define the origin of rotation (xp, yp, zp),
- 1 to define the the scale factor k.
Example: RD datum shift (Netherlands)
- tx, ty, tz : 593.0248, 25.9984, 478.7459 (meters)
- rx, ry, rz : 1.9342, -1.6677, 9.1019 (10^-6 rad)
- xp, yp, zp : 3903453.1482, 368135.3134, 5012970.3051 (meters, Amersfoort)
- k: 4.0725 (ppm)
Bursa-Wolfe with 7 parameters:
- the origin of rotation is the center of the earth (0,0,0).
- dx, dy and dz have other values than the previous method,
- dx, dy and dz are dependend of the rotation parameters, this is
why the previous method is better.
Example: RD datum shift (Netherlands)
- tx, ty, tz : 565.4171, 50.3319, 465.5524 (meters)
- rx, ry, rz : 1.9342, -1.6677, 9.1019 (10^-6 rad)
- k: 4.0725 (ppm)
Molodensky with 3 parameters
In this method only the 3 displacement parameters of the Molodensky-Badekas method are used (593, 26, 479). This method is used by OziExplorer.
Rotations are defined in radians, or in seconds, multiplied with a factor, mostly 1000000. There are two standards for rotations, the "Position Vector" and the "Coordinate Frame", the difference is the sign of the values. Sometimes the datum shift is defined inclusive the relative values compared to the WGS84 reference ellipsoid da and df, the value for df is often multiplied by a factor, usually 10000.
The datum shift for our maps could not be found on the Internet. This means
we have to calculate them and add them in the datums.dat file with Name, id, tx, ty, tz. We name our Map datum NDG (Nord de Guerre), the id of the Du Plessis ellipsoid in OziExplorer is 28.
Calculate datum shift parametersThe datum shift values can be calculated with the lat/lon coordinates of minimal 3 reference points for both datums (NDG map datum and WGS84 GPS datum). Reference points which can be clearly identified in the map and in Google Earth are for instance bridges and rail crossings. OziExplorer can be used to get waypoints from both resources. I choose several points on multiple maps for a acceptable precise determination. During the calculation I skip the points which show a bad fit, these points could have been changed during 65 year.
First we digitize the waypoints in the local datum of the maps and save them in a waypoint file, then we digitize the same waypoints in Google Earth.
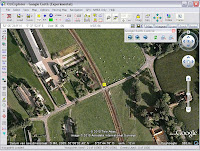
This can be done with OziExplorer by loading the Google Earth map, the necessary map file can be loaded from the
OziExplorer website. After the waypoint file is saved it can be used for calculating the datum shift.
To calculate the datum shift the shareware program
Sevenpar of Killet Soft can be used. With Sevenpar the 7 parameters of the Bursa-Wolfe and the 3 parameters of Molodensky can be calculated with many reference points to get precise results. Another option is to use the open source
ILWIS add-on Inverse Molodensky. By using this program you must define the lat/lon coordinates of the reference points in seconds. Inverse Molodensky is limited to maximal 3 reference points, by calculating multiple sets of 3 points you can achieve reasonable result by averaging.
The results of my calculations gives the following line in datums.dat: NDG, 28, 1383, 44, 454. The standard deviation of the results were 7 m for tx, ty and tz.
This completes the data we need to calibrate the mapserie M831.
Finishing touchThe calibration setup must be updated with the new Map datum NDG. Don't forget to copy the updated datums.dat file to your OziExplorerCE device.
With the Img2Ozf utility of OziExplorer you can generate tiles from the image with multiple zoomlevels, this will give you a better performance and better quality. For OziExplorerCE it is a must.
With these digital maps you can walk or drive back in time 65 years ago, that is fun. With the freeware program
OziMaptoKMZ you can generate an overlay for Google Earth, with the slider you can define the transparancy of the map, it's nice to see what is changed in 65 years.
What was not possibleUnfortunately it is not possible with OziExplorer to display the X,Y grid or to calculated the X,Y coordinates for this projection. On the border of the map the False Coordinates of Origin are given: 600,000m N and 300,000m E. In the Projection Setup menu it is not possible to define these values. In OziExplorer only a few grids are supported: UTM and user defined grids (Transverse Mercator). For the Dutch maps it is possible in this way to define a user RD grid. On the OziExplorer website we can read at Future Plans that support for more local grids will be extended.
By the way I found that two ways are used to define False Northing, related to the equator or related to the origin.

 Ilwis
Ilwis


